Skip to main content
Skip to search
Virginia Tech®
home
Universal Access Toggle
Universal Access
Close Universal Access dialog
Universal Access Options
Report a barrier
Accessibility portal
Pause all background videos
Underline all links
Apply
Visit
Give
Shop
Hokie Sports Shop
Apparel, clothing, gear and merchandise
Hokie Shop
University Bookstore, merchandise and gifts
Hokie Gear
Everything you need to know about Hokie gear
Hokie License Plates
Part of every Virginia Tech plate purchase funds scholarships
Resources for
Future Students
Current Students
Parents and Families
Faculty and Staff
Alumni
Industry and Partners
Graduate School
Menu
Graduate School
About
About Submenu Toggle
What We Do
Who We Are
Contact Us
Dean's Corner
History of the Graduate School
Honors and Awards
Mission and Governance
Giving to the Graduate School
Graduate School News
GLC-public-art
Academics
Academics Submenu Toggle
Courses and Scheduling
Degrees and Programs
Expectations for Graduate Study
Forms for Graduate Students
Graduate Catalog
Graduate Honor System
Policies and Procedures
Using Ithenticate
What You Need to Graduate
Admissions
Admissions Submenu Toggle
Accelerated Master's Programs
Getting ready to apply
Getting Started as a Student
Holistic Admissions
How to Apply
New Graduate Student Orientation
Non-degree Programs
Prospective Student FAQs
Tuition and Costs
Visit Us
Locations
Contact US
Data and Reports
Data and Reports Submenu Toggle
Graduate School Annual Reports
Graduate School Climate Surveys
Interdisciplinary Graduate Education
Coalition for Next Generation Life Science
Graduate Degrees Awarded and Time to Degree
Graduate Retention and Completion
Graduate Student Enrollment
Graduate Certificates
Graduate Student Assistantships
Task force reports
Graduate School Exit Surveys
Survey of Earned Doctorates
Global Perspectives Program Alumni Survey
Graduate Program Holistic Admissions Practices Survey
Graduate Student Admissions
Graduate School Data Index
Graduate Student Tabular Data
Alumni Insights Doctoral Career Outcomes
Funding for Students
Funding for Students Submenu Toggle
Work-Life Grants
Graduate Assistantship Information for Students
Student-initiated Fellowships and Scholarships
Funding Sponsored by the Graduate School
Forms
Graduate Catalog
Graduate School Initiatives
Graduate School Initiatives Submenu Toggle
Citizen Scholar program
Communicating Science
Graduate Teaching Assistants (GTA)
Professional Development
Professional Development Submenu Toggle
Professional Development Workshops
Publication Academy Course
Student Services
Student Services Submenu Toggle
Community Scholars
Bouchet Graduate Honor Society
Graduate Cooperative Education Program
Graduate Education Week 2026
Graduate Life Center
Graduate School On-demand Workshops
Graduate Student Organizations
HBCU/MSI Research Summit
Health and Wellness
Housing
Orientation and Welcome Events
Professional Development
Spouses, Partners, and Children
Resources for Roanoke Students
Resources for Virtual Students
Student Service and Strategic Partnerships Directory
Your Voice Matters
GearUp! Fall 2025
Apply
Visit
Give
Shop
Hokie Sports Shop
Apparel, clothing, gear and merchandise
Hokie Shop
University Bookstore, merchandise and gifts
Hokie Gear
Everything you need to know about Hokie gear
Hokie License Plates
Part of every Virginia Tech plate purchase funds scholarships
Resources for
Future Students
Current Students
Parents and Families
Faculty and Staff
Alumni
Industry and Partners
Search
Search query
×
search
Search this site
Search all vt.edu sites
People search
Frequent Searches:
Web
results for
Sort by relevance
Sort by date
News
results for
Sort by relevance
Sort by date
Filter search
Categories
Academics
Campus Experience
Culture
Impact
Research
Story type
Feature
Notice
Story
Video
Apply filters
Clear filters
Video
results for
Sort by relevance
Sort by date
People
results for
Graduate School
/
Data and Reports
/
Graduate School Climate Surveys
/
Compare Climate Survey Results
/
Explore
Graduate School Annual Reports
Graduate School Climate Surveys
2013 Climate Survey
2016 Climate Survey
2019 Climate Survey Report
Current page:
Compare Climate Survey Results
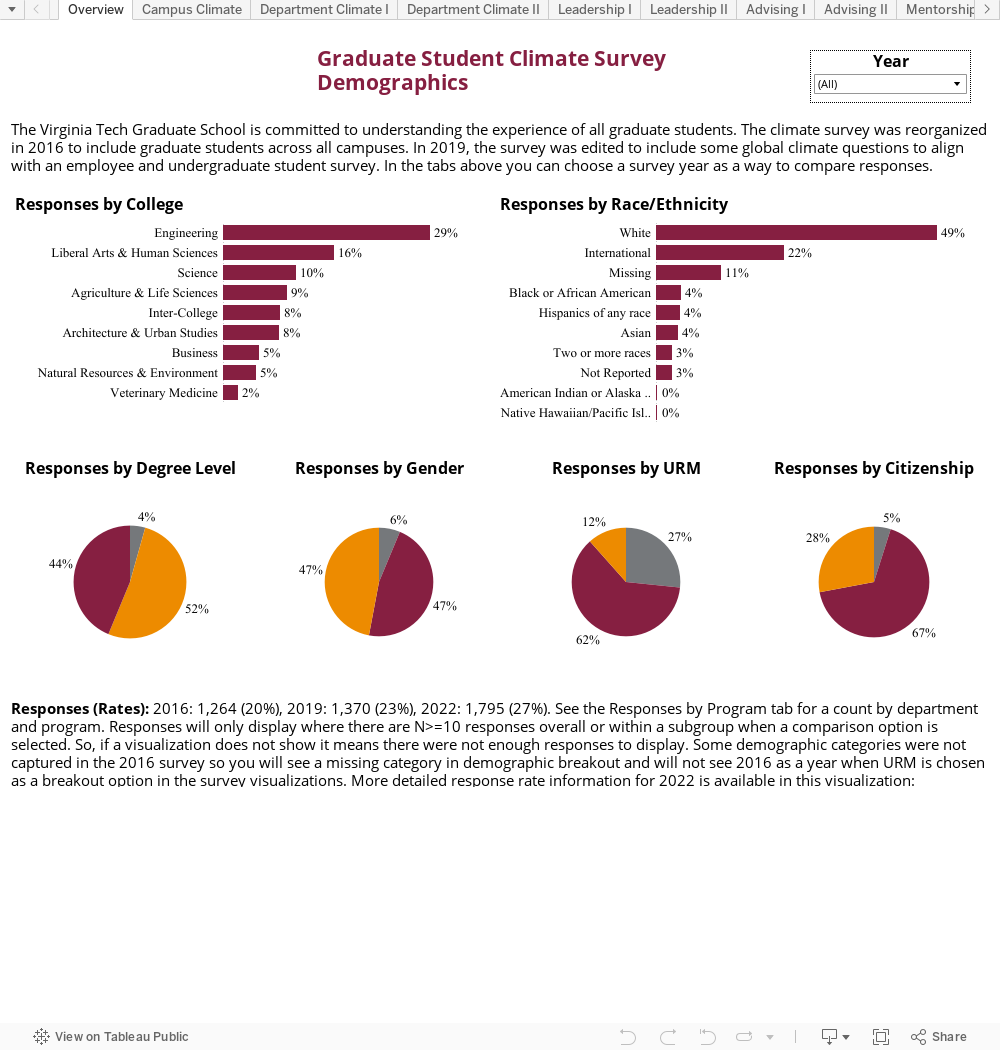
Graduate Student Climate Survey 2022
2025 Climate Survey
Interdisciplinary Graduate Education
Coalition for Next Generation Life Science
Graduate Degrees Awarded and Time to Degree
Graduate Retention and Completion
Graduate Student Enrollment
Graduate Certificates
Graduate Student Assistantships
Task force reports
Graduate School Exit Surveys
Survey of Earned Doctorates
Global Perspectives Program Alumni Survey
Graduate Program Holistic Admissions Practices Survey
Graduate Student Admissions
Graduate School Data Index
Graduate Student Tabular Data
Alumni Insights Doctoral Career Outcomes
Compare Climate Survey Results